How to Measure the Success of Your Business Blog
We’re all about creating results-driven content, and like you, when it comes to our business we have zero free time. That’s why we never tell our clients (or you!) to invest time and resources into blogging, or anything else, if it didn’t set you up to get real, measurable results.
Thankfully, blogging has a major ROI. It’s 100% worth your time, and if you implement the tips in this blog, it will yield trackable results!
First, a quick recap from our How to Start an Efficient, Effective, Results-Driven Business Blog post.
Blogging can help your business:
- Attract new website visitors
- Improve your conversion rates
- Build relationships with current and future clients or customers
- Build trust with your readers and community
- Improve your website engagement
That being said, it only works if you have a strategy in place. And the key to a successful strategy is being able to track what’s working and not working. To make sure your blogging efforts are working, you’ll want to track the results of your posts in Google Analytics.
Don’t have google analytics set up yet? We’ve got you covered with our How to Set Up Google Analytics post.
Table of Contents
- What does a successful business blog look like
- How to measure if your blog attracts website visitors
- How to measure if your blog post is engaging your readers
- How to measure if your blog posts are converting readers in to paying customers
- Is your business blog set up for success?
What does a successful business blog look like?
A successful blog will bring new visitors to your website, feature content that people actually read and engage with, and convert customers to an email list or online community.
Each of these descriptors is essentially a blogging goal. And, you can track your progress on these goals by monitoring a few “key performance indicators” (or KPIs) every month.
Pro Tip: Take time each month to review your KPIs and put them into a spreadsheet. This way, you can monitor your performance over time.
Make a copy of our free Blog Performance Tracking Sheet and enter in your KPI metrics as you read through the rest of this post!
How to measure whether or not your blog is attracting website visitors
The first thing to measure is whether or not you’re growing your website traffic with your blog. You could be seeing new traffic because you post all your blogs on your social media and people come to read them, because you send email newsletters with links to your posts, or because you have an SEO content strategy in place!
In our opinion, one of the greatest benefits of a business blog is the ability to attract new website visitors with SEO optimized blog content. We love a good content strategy because it helps you and your audience at the same time. If you think about it, your target audience is already turning to Google for answers to problems that you can solve. Creating blog content that answers those questions means you can show up in their searches as the expert they’re looking for! Win-win.
Measure how many times your blog post was read
First and foremost, you need to track how many times people are actually visiting your blog post with the intention to read it. This doesn’t tell you how many people actually read it (we’ll get to that later on), but it’s a start.
KPI to track: Pageviews on blog pages
Where to find it
In Google Analytics, navigate to your Content Drilldown Report under “Behaviour”

Now, as long as your website structure is set up properly, you’ll see folders for the parent pages on your site. One of those is probably “/blog/” or something similar. Click on that to only look at traffic to your blog posts.
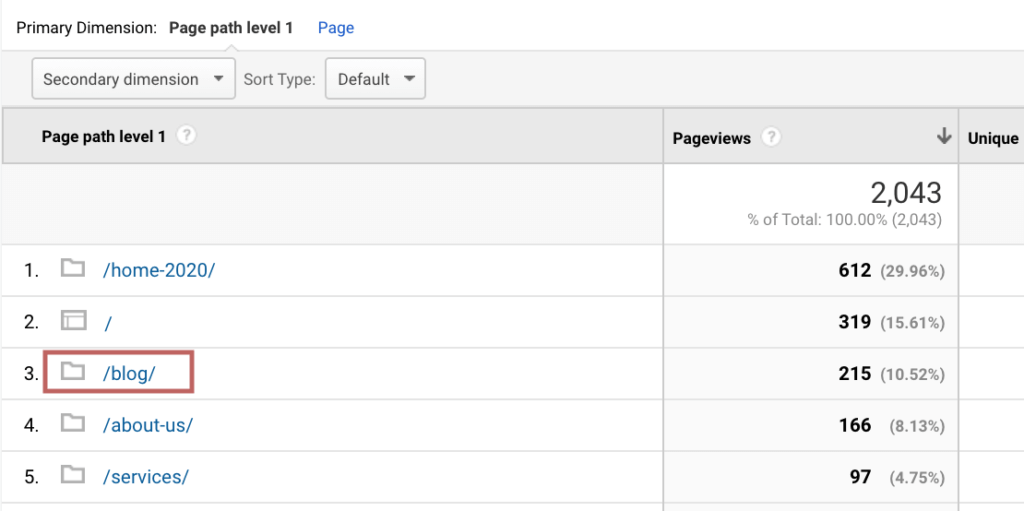
Hooray! You now have a row for each of your individual blog posts, and can see their respective metrics!
How to measure success
Take a look at the number of Pageviews (times the blog post was viewed in total) and how many Unique Pageviews (times the post was viewed, but excluding multiple visits by the same person).

Generally, your Pageviews will fluctuate over time for various reasons. These reasons could be the seasonality of the content, whether or not you’re sharing it on social media, or how SEO optimized the content is.
The most important thing is to note which posts have the most (or least!) traffic. And, that if you see any major changes month-over-month, you look deeper into why that may be.
Measure how many new visitors read your blog posts
Now that you know which posts are getting the most traffic, we want to differentiate between the ones that are bringing new visitors to your site, versus which ones are engaging your returning visitors.
Note that this doesn’t mean that one type of visitor is better than the other! Ideally, your posts will have a balance of new visitors and returning visitors. But, if you’re looking at growing your website, you’ll want to hone in on your new visitors.
KPI to track: New visitors to blog pages
Where to find it
Starting from the blog folder in your Content Drilldown report that you navigated to in the previous step, we’re going to add a segment.

Scroll down in the pre-made segments until you see “New Users” and click the checkbox beside it. Then, click “Apply”.

You now have a breakdown of which posts your new users are reading!
How to measure success
Keep track of which posts your new users are most often engaging with. Is that content tailored to introducing them to your brand?
Measure how well your content is optimized for SEO
When your blog is well optimized for SEO, you should see a gradual monthly increase in organic traffic from search engines.
Note: “Organic search” is Google Analytics’ way of saying “people who came to your site from unpaid links on search engines (not paid ads).”
BIG NOTE: It’s important to realize that strong SEO takes time. You may see some results right away, but it’s more likely to take between 3 and 6 months to get a real idea of what’s working and what’s not.
KPI to track: Sessions landing on your blog posts from ‘organic search’
Where to find it
First, in Google Analytics navigate to your Channels Report under “Acquisition”
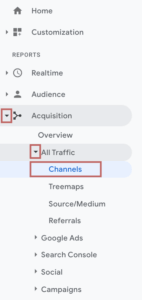
Then, Click on “Organic Search”

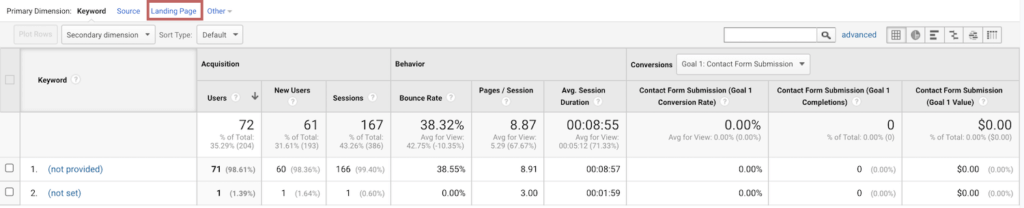
Now, we want to change the view so we’re looking at the “Landing Page” they entered your site on (aka, which page or blog post they clicked on in Google).
And now, we can filter out all the other pages on your site by filtering to only look at blog posts.
This can vary a bit depending on how your site is set up. Open up one of your published blog posts and look at the URL. Does it add “/blog/” between your domain name and the slug for your post? Some sites are also set up to add the date like “/2020-09/” for a post published in September of 2020. Ultimately, you want to find what unique identifier all (or most) of your blogs have in common. It could be “/blog/” or it could be “/2020/”.
Note: If your website uses the date format and you want a search that encompasses posts across years, or if your website doesn’t put anything additional after your domain name, you may need some help from a Google Analytics Consultant. If this is you, reach out to a Google Analytics Consultant or book a consultation with us. We’d be happy to set this up for you.
Now that you know what you’re searching for in the URL, enter it in your advanced search bar. And there you have it!!
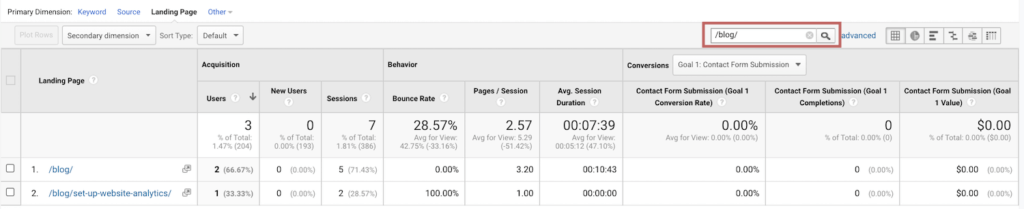
How to measure success
Take a look at how many sessions (times people entered your blog post from an organic google search) each of your blogs has during the time period. Track this KPI each month for each of your posts.
The posts that are already well optimized for SEO should see regular organic traffic. Posts you optimize now should see steady improvements in traffic over the next 2-6 months.
How to measure if your blog post is engaging your readers
It’s important that your blog posts are engaging because if they’re not, your readers will just click the X in the corner and leave. But, short of straight-up asking readers if they found your content valuable, how do you know if they are actually reading it?
There are a few KPIs we can measure to better understand which posts are offering value to your readers and building a connection with them, and which ones might need a bit more work to get there.
Measure how long people spend on your post
One of the simplest ways to measure post engagement is to look at is how long your readers spend on the page.
Keep in mind that you do need to use some critical thinking to determine what a ‘good’ result is here. For short posts that don’t have overly complex content and are easily readable, a 2-3 minute average time is excellent. For long posts with lots of valuable information and maybe an accompanying worksheet, expect your users to stay much longer.
KPI to track: Average Time on Page of blog posts
Where to find it
You want to get back to the Blog Folder in the Content Drilldown Report that we found when finding how many Pageviews each post had.
But this time, take a look at the “Average Time on Page” column.

How to measure success
Like we mentioned above, more time spent on-page isn’t always better. Consider the content on each post, and how long you want someone to spend on it. If the data is telling you that people are spending way more time, maybe you need to simplify that content. If they’re not spending enough time, your content is not as engaging as it could be.
Note: This metric can be skewed if the number of pageviews is really low, so be cautious of outliers or one-offs if you have a low number of total posts. If the KPI looks odd to you but the pageviews are less than 30, don’t make any changes until you get some more data.
Measure how many people leave your post after reading it
In most cases, you’re creating content on your site with the intent of guiding them towards a sale or a signup. Essentially, you’re trying to get them to take another action after reading the post. This action could be a conversion, or it could be as simple as viewing another blog post, or a sales page.
If keeping people on your site longer is the goal, then we want to minimize the number of people who visit your post and then leave your site without taking action. The metric that measures this is your Bounce Rate.
KPI to track: Bounce Rate on blog posts
Where to find it
You want to get back to the Blog Folder in the Content Drilldown Report that we found when finding how many Pageviews each post had.
This time, let’s look at the “Bounce Rate” column.

How to measure success
The Bounce Rate is the percentage of people who landed on this page and then left without taking any action or additional steps. You want this number to be as low as possible!
Track it over time, then if one of your posts has a much higher bounce rate than the others, consider how you can make the content more engaging. Brainstorm ways to get readers to click on a link or a call to action to learn more.
Note: Blog posts traditionally have higher bounce rates than your other pages so don’t worry if you see this in your reporting. Hubspot reported that blog posts on average see bounce rates of 70-90%, whereas other pages see bounce rates of 10-50% depending on the industry.
How to measure if your blog posts are converting readers into paying customers
You’re creating your posts with an endgame in mind, and that endgame is almost always conversion. Depending on your business and the blog post, “conversion” could mean getting people to:
- Click “book an appointment” (and fill out the form)
- Purchase your products
- Sign up for your mailing list
- Download a freebie
Note: If you don’t have any goals in Google Analytics set up, your reports for this section will not show any data, and inputting goals requires a bit of extra work in Google Analytics. To set goals, you might have to set up Google Tag Manager for your website, which could mean hiring a Google Analytics Consultant.
If you’d like our help with this, book a consultation with us to learn more.
Measure how many people converted on your post
If you have an embedded sign-up form on your post that invites people to download a freebie or to subscribe to your mailing list (or any other conversion that they complete on that specific page), you can track the conversion rate of your post
KPI to track: Conversion Rate of blog post
Where to find it
We first need to find the number of conversions that happened on the post. We find this on the Goal URLs Report under ‘Conversions’.

Now, just like how you filtered certain posts when you were measuring the organic sessions to determine the SEO performance, we’re going to use the search bar to look for either group of posts or individual posts.

And there you have it! If any conversions have happened on your blog posts, it’ll list out those posts here.
Now, use the Unique Pageviews metric you found before, and plug your values into the following formula to get your conversion rate.
Conversion Rate of Post = Goal Completions on Post / Unique Pageviews on Post
How to measure success
Take note of which posts have the highest conversion rates. Looking at the content on those posts, why do you think that is? See if you can test out your hypotheses on some of your lower-converting posts to improve those conversion rates.
Note: This is another metric that can be can be skewed if the number of unique pageviews is really low. Before you make any decisions or changes to your content, you might want to wait until you have more data.
Measure which posts contributed to conversions
Not all conversions will happen on the posts themselves. And posts that support readers and bring them closer to conversion is still valuable to your strategy.
But, these are the hardest posts to track! This metric varies for each website, so it’s not possible for us to put together a generic KPI that applies for everyone.
If this is something you want to measure, reach out to a Google Analytics Consultant or book a consultation with us.
Is your business blog set up for success?
We recommend setting aside time each month to look into each of these KPIs and log them in a tracking sheet. Once you have all your numbers in one place, you’ll be able to easily track and understand the ROI of your blog. You’ll be able to see what’s working and what’s not, and you’ll have a good idea of the steps you can take to improve it.
If these numbers and spreadsheets feel overwhelming, you don’t have the time for any of this, or you looked already and things look off to you, reach out. We’re here to help!
We’re data-driven content strategists who specialize in creating content strategies and blog content that drives ROI for businesses. If you’d like to streamline your marketing, blog more efficiently, or take things up a notch, book a consultation with us! We’ll walk you through our process and make sure that growing your business leaves you feeling excited, proud, and in control.


